
Seattle Solvers
The 2026 Lovelace Division Inspire second-place team's training, design measures, and software revisions.
Seattle Solvers, team 23511, received Inspire second place in the Lovelace Division at the 2026 Championship. Its DECODE explains how members develop skills and how the team uses measurements to guide changes.
Member learning
Page 3 gives training a clear progression: introductory lessons, offseason practice, independent work, and leadership. The examples show how responsibility grows as members gain experience.
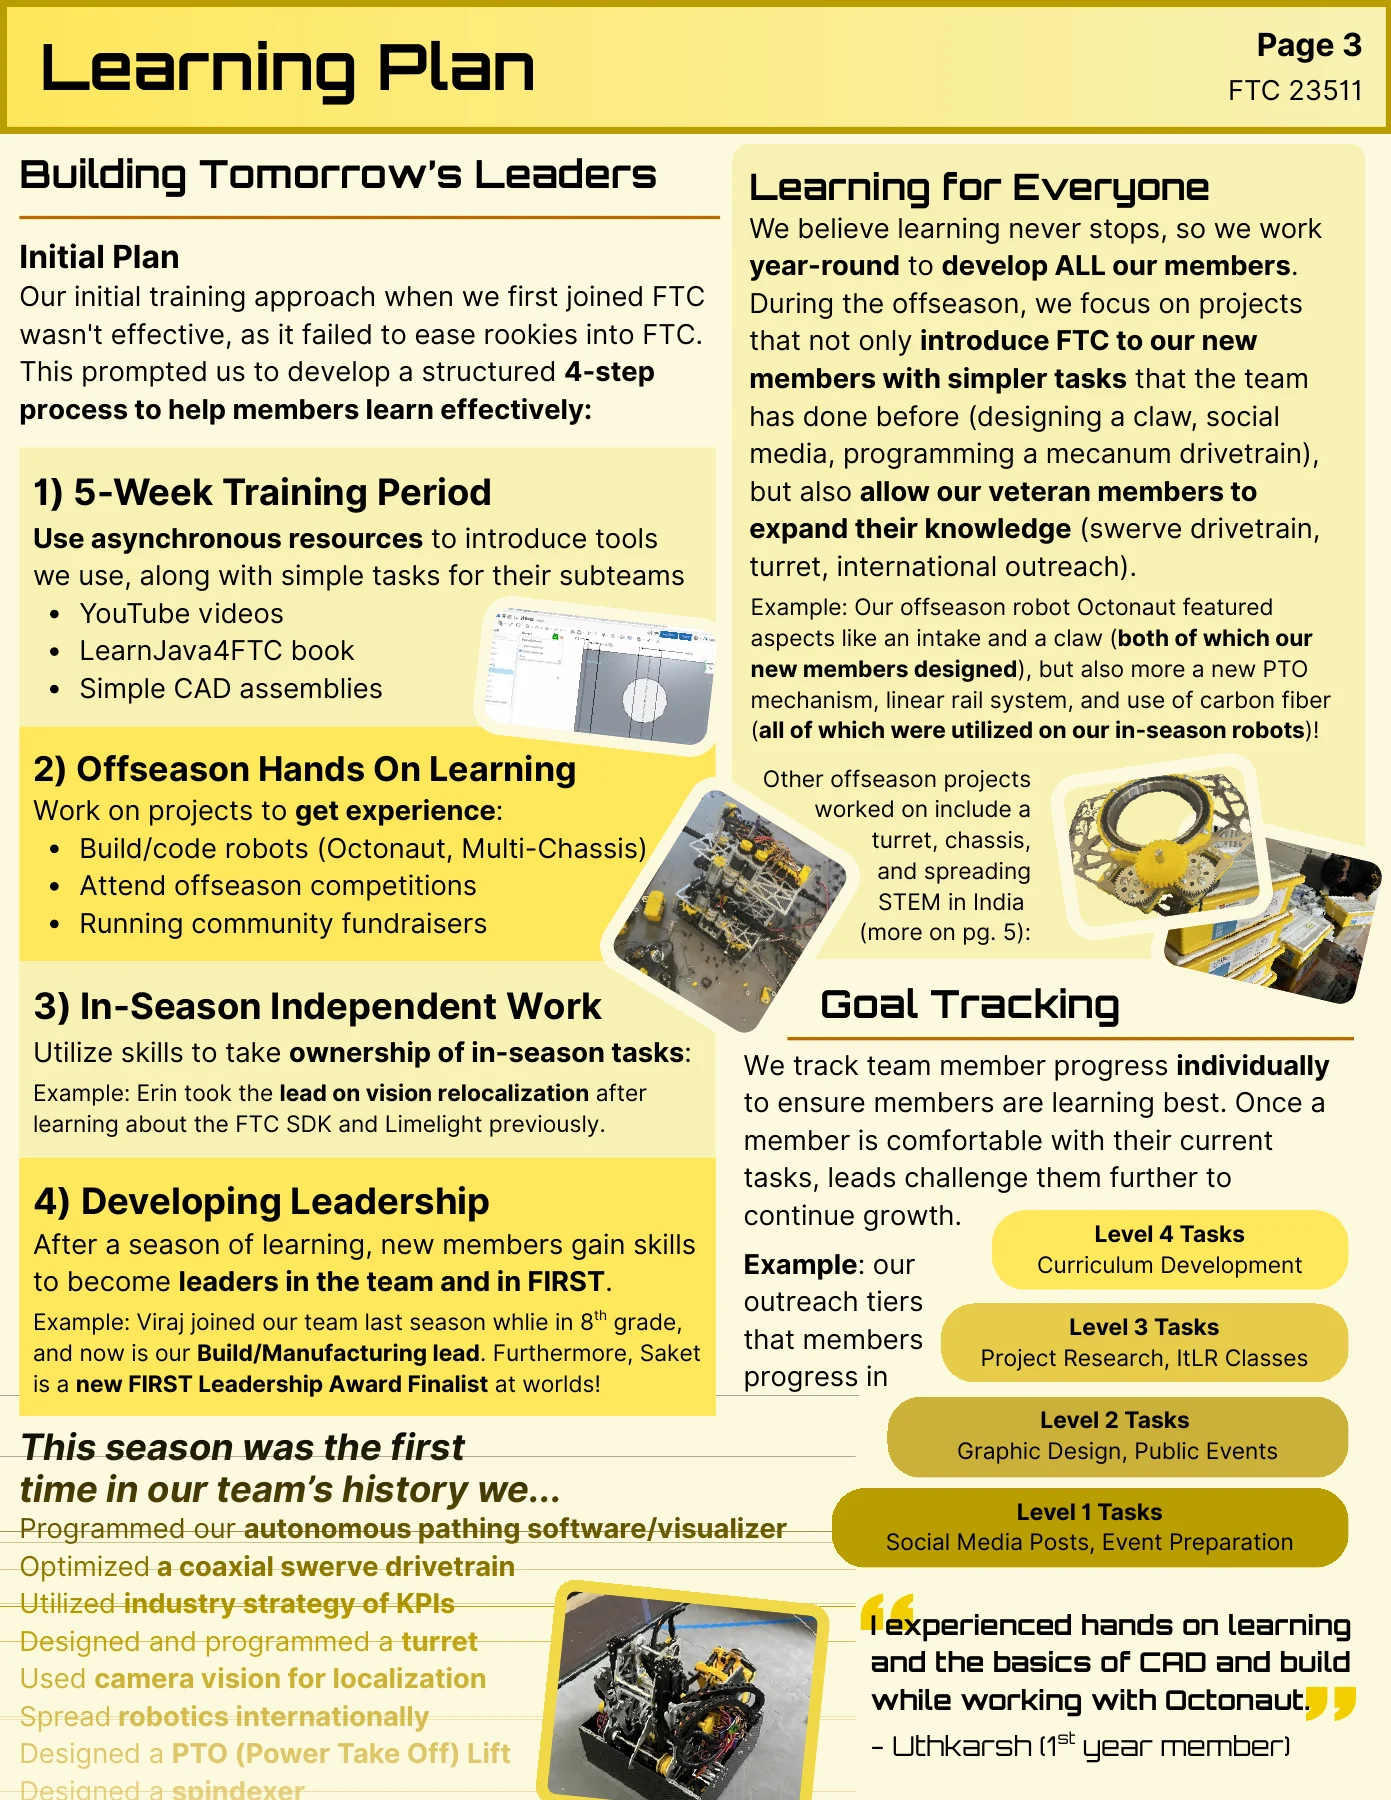
This helps a reader understand what training leads to. The page includes projects members can work on and ways the team tracks their progress, rather than stopping at a list of workshops.
You can explain one member's learning the same way. Show the starting skill, the practice, and something they later completed independently.
Design goals
Pages 8–9 connect game strategy to measurements such as travel time, time, launch time, and scoring accuracy. These give the team a way to compare designs against what it wants the robot to do.
The portfolio also credits the professional who introduced this way of working. Readers can follow the connection from outside advice to the team's own design decisions.
Choose a measure that suits your problem. For time, define where the cycle starts and ends. Then use that same definition when comparing designs.
Software changes
Page 15 follows several approaches to localization. The diagrams and notes explain why the team moved between camera-based measurements, , and combinations of the two.
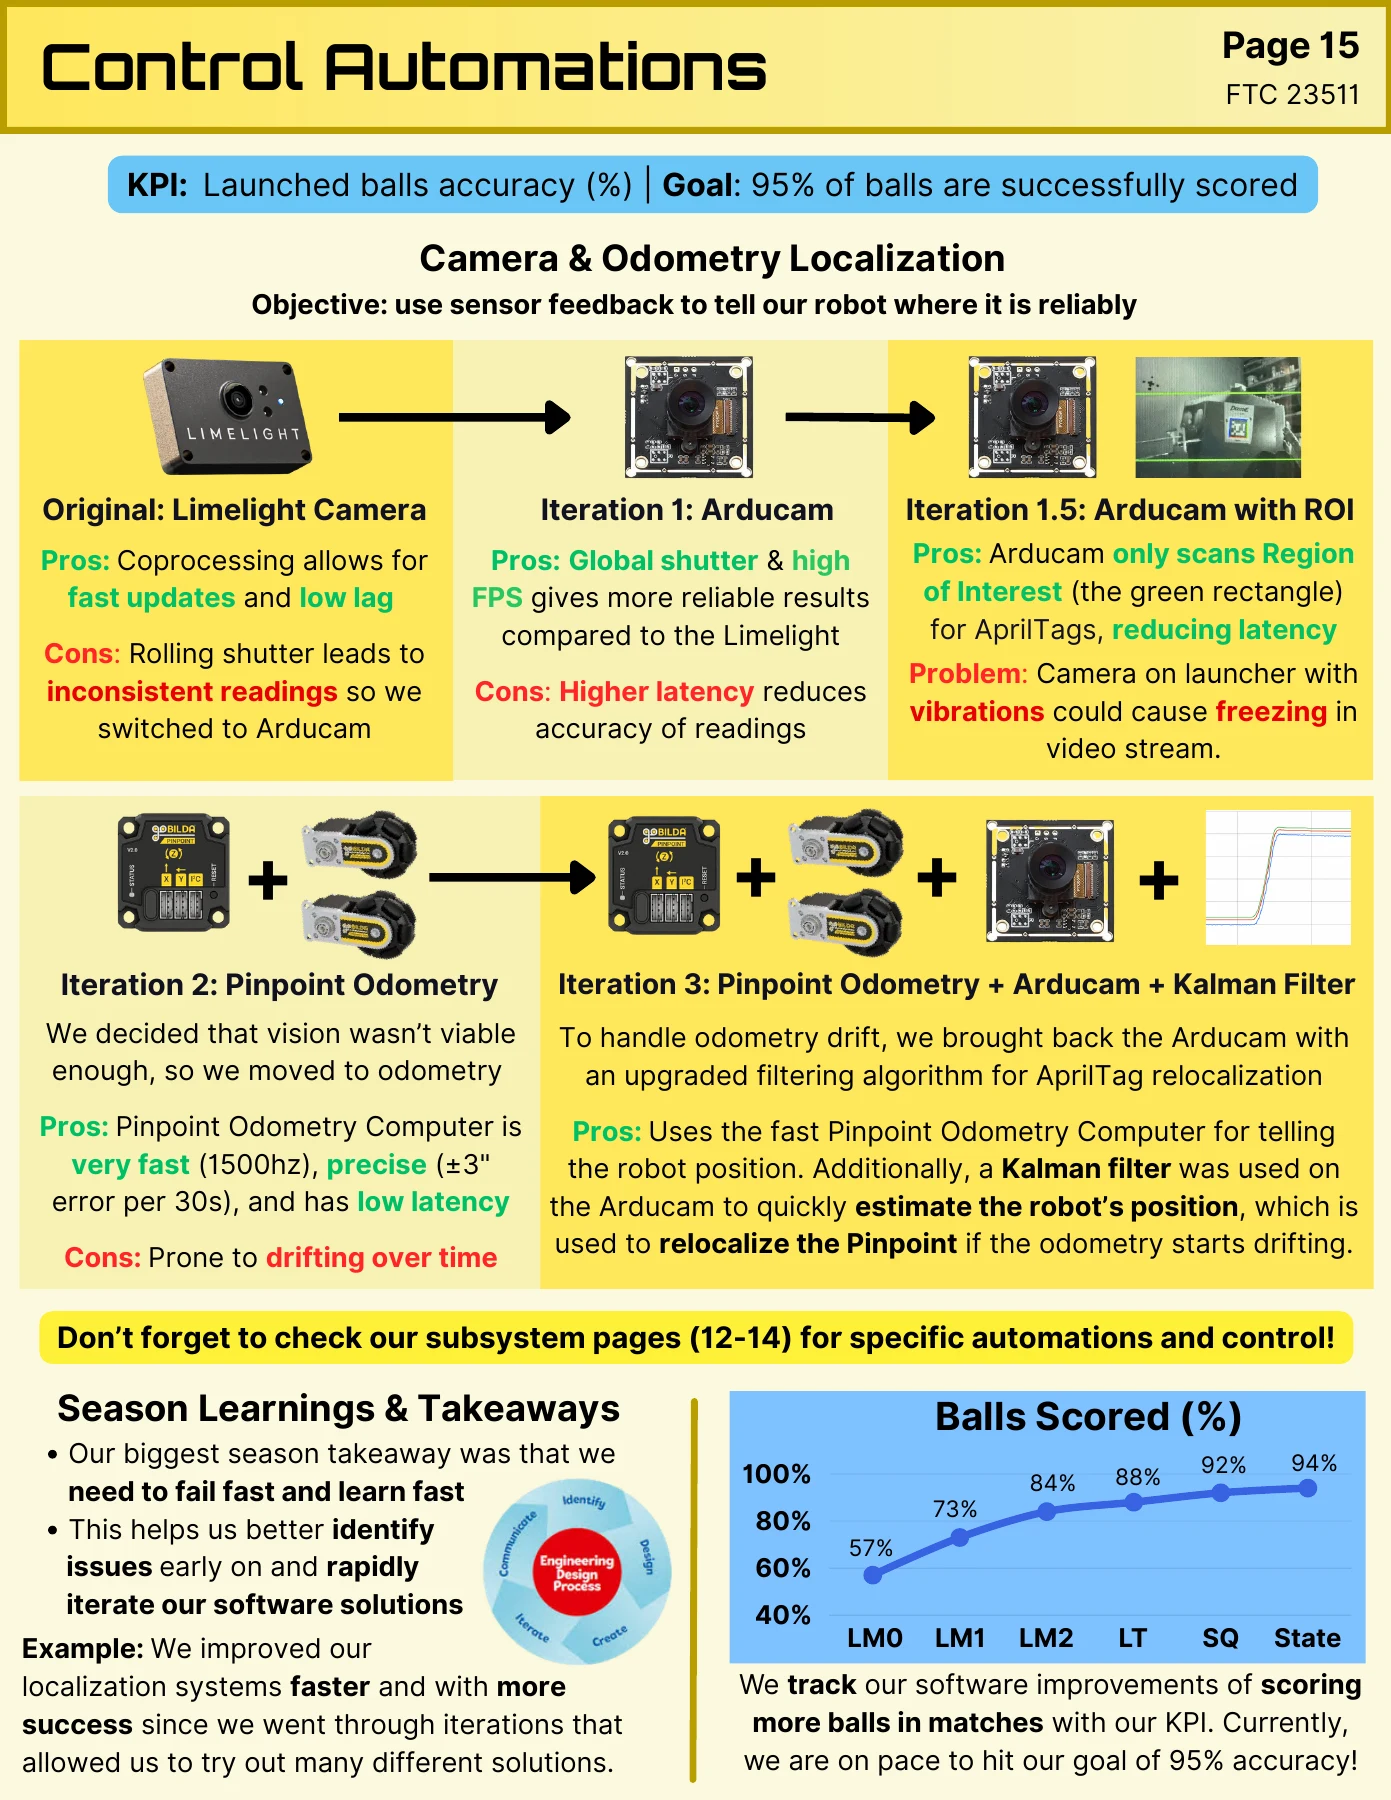
Each version explains what the team tried and what it learned. A graph below the revisions shows reported scoring progress through the , with a separate goal above it.
The graph ends at a reported 94%, while the page names 95% as its goal. Keeping those two values distinct lets a reader see both the progress and the remaining objective. For your own graph, label the target, the measured values, the period, and what counts as a successful attempt.
For your own , keep short notes about the problem that prompted each change. A sequence of diagrams can make those decisions easier to explain than a list of library names.
Read this beside Blu Cru's driver-state example. Seattle's sequence helps explain development over the season; Blu Cru's diagram helps explain behaviour during one driver cycle. Choose the one that answers your reader's question, or give them separate space if both are needed.
Team organisation
Page 2 explains how the team changed its planning after a scheduling problem in the previous season. It also shows how new members and future leaders fit into the team as founding members prepare to graduate.
That gives the plan a reason. When describing your own organisation, explain the problem you were trying to solve and how the new approach helped people do their work.