
Programming
Explain software decisions through diagrams, measured results, and recovery, with examples from team portfolios.
Explain what your code helps the do and how you know it works. A diagram, a short example, and a useful test result usually tell a reader more than a long list of libraries.
Control systems
For the Control Award, explain the problem, the control components, and how feedback improves the robot's performance. Show what the robot measures and what it does with that reading. You do not need to print the full source code.
For example:
| Component | Job | How the robot uses it |
|---|---|---|
| Lift and controller | Stop the lift at a chosen height | Compare the measured height with the target and adjust power |
| Home switch | Find a known starting position | Detect home and reset the position reference using your homing routine |
| Camera and aiming code | Aim from different positions | Use a valid target reading to adjust aim, and handle a missing target |
Describe the components on your own robot. Say whether they run in , , or both.
Read two control pages
Blu Cru and Seattle Solvers both explain control systems in DECODE, but they answer different questions. Study the diagram or comparison that suits the story you need to tell.
Explain what an action does
Blu Cru's page 15 puts a driver state diagram beside its aiming explanation. On the left, follow the normal cycle from idle to intake to shooting. Then find the branches that let the driver outtake, reset, or return to manual control.
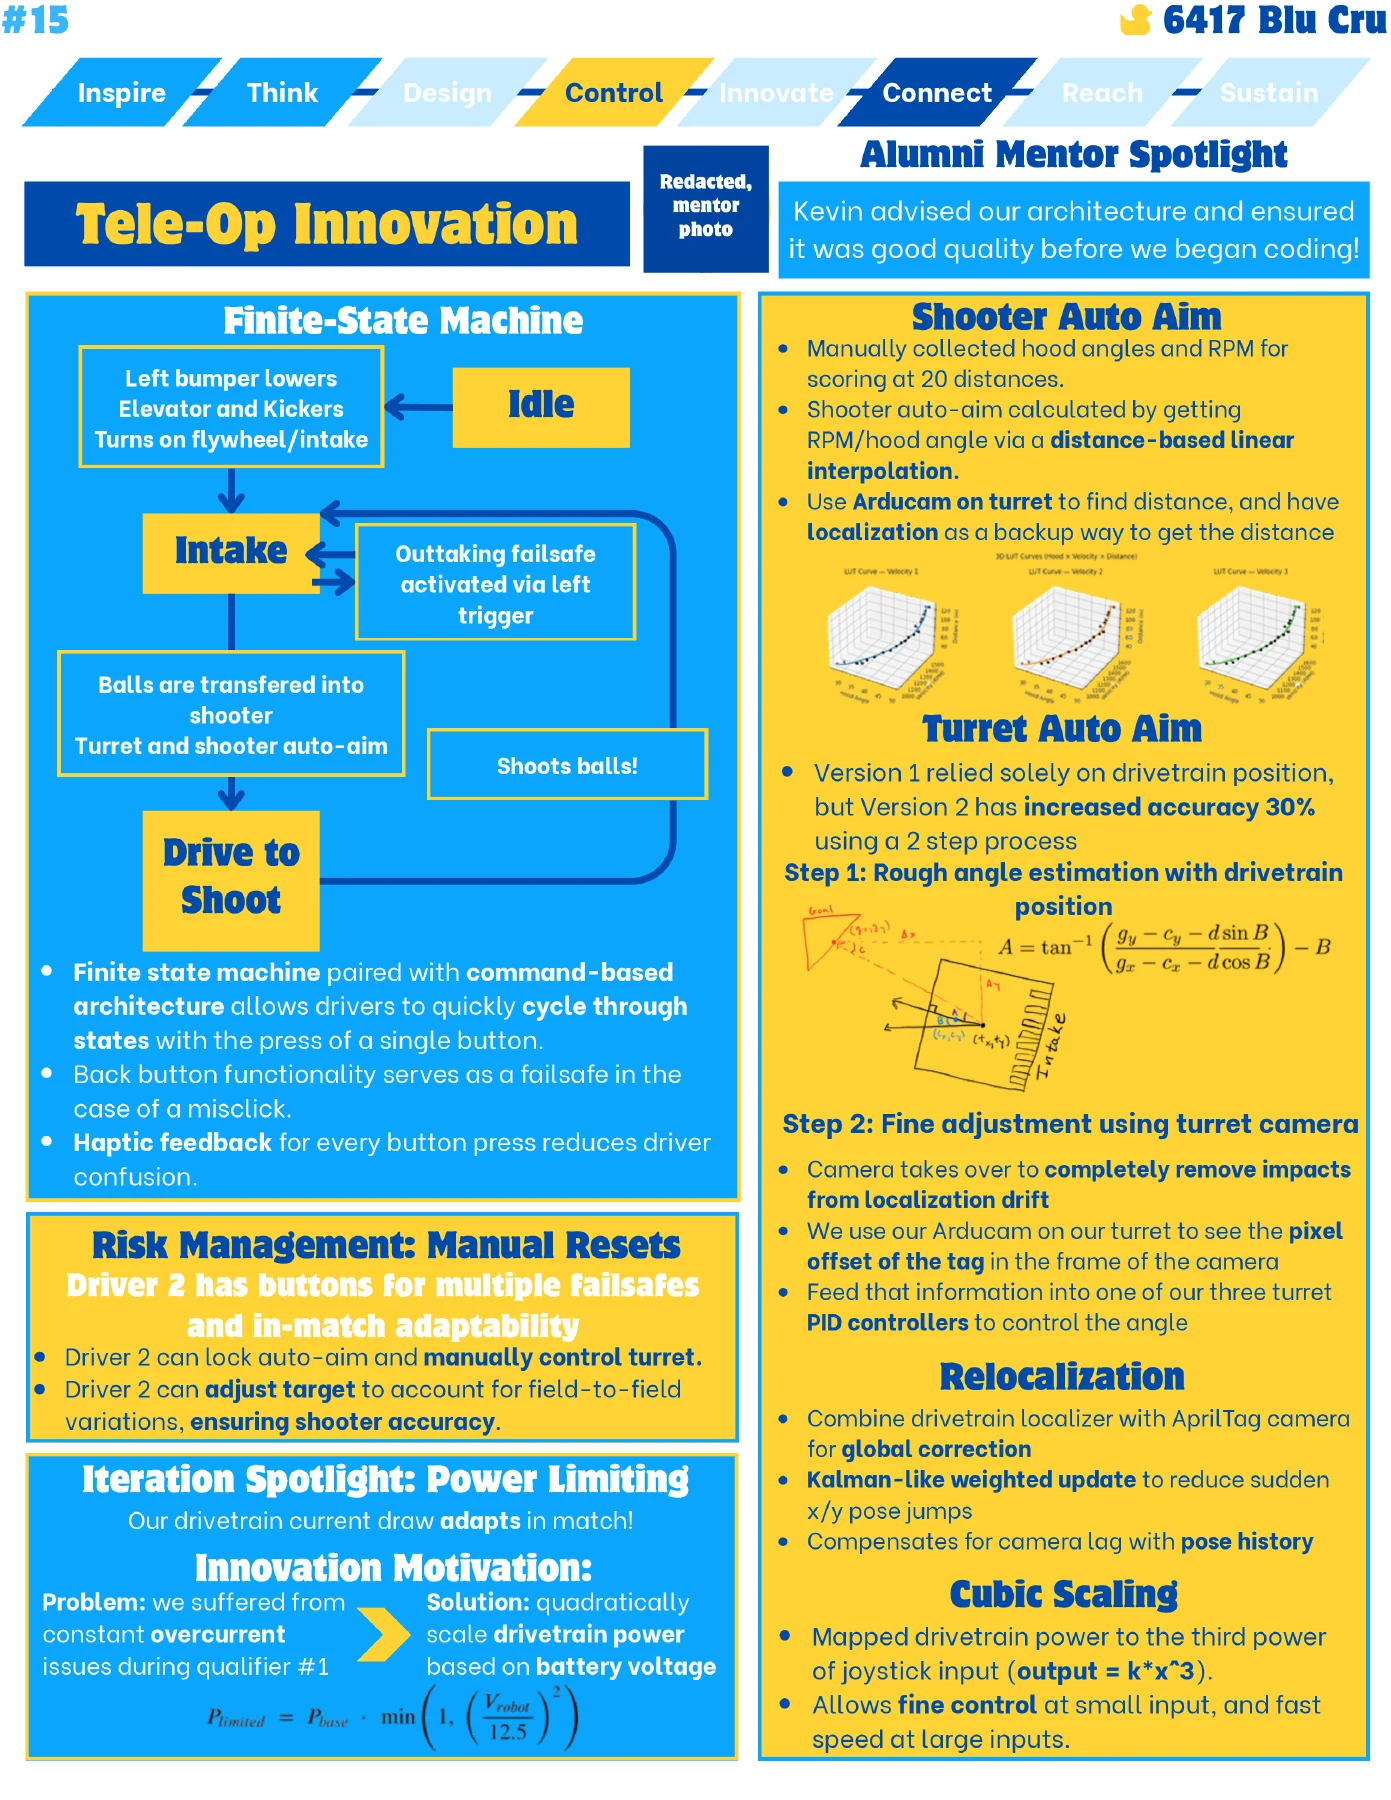
The driver inputs, automatic actions, and escape paths are visible without reading source code. The aiming section then explains how a position-based estimate and camera feedback contribute to the same task.
For your system, label each transition with the button, sensor condition, or completed action that causes it. Show what the driver can cancel and what the robot does afterward. Include only branches your code actually implements.
Explain why the software changed
Seattle Solvers' page 15 follows its localization approaches through several revisions. Each picture names the configuration, and the nearby notes describe the problem that led to the next one. The scoring graph below connects the technical work to a season goal.
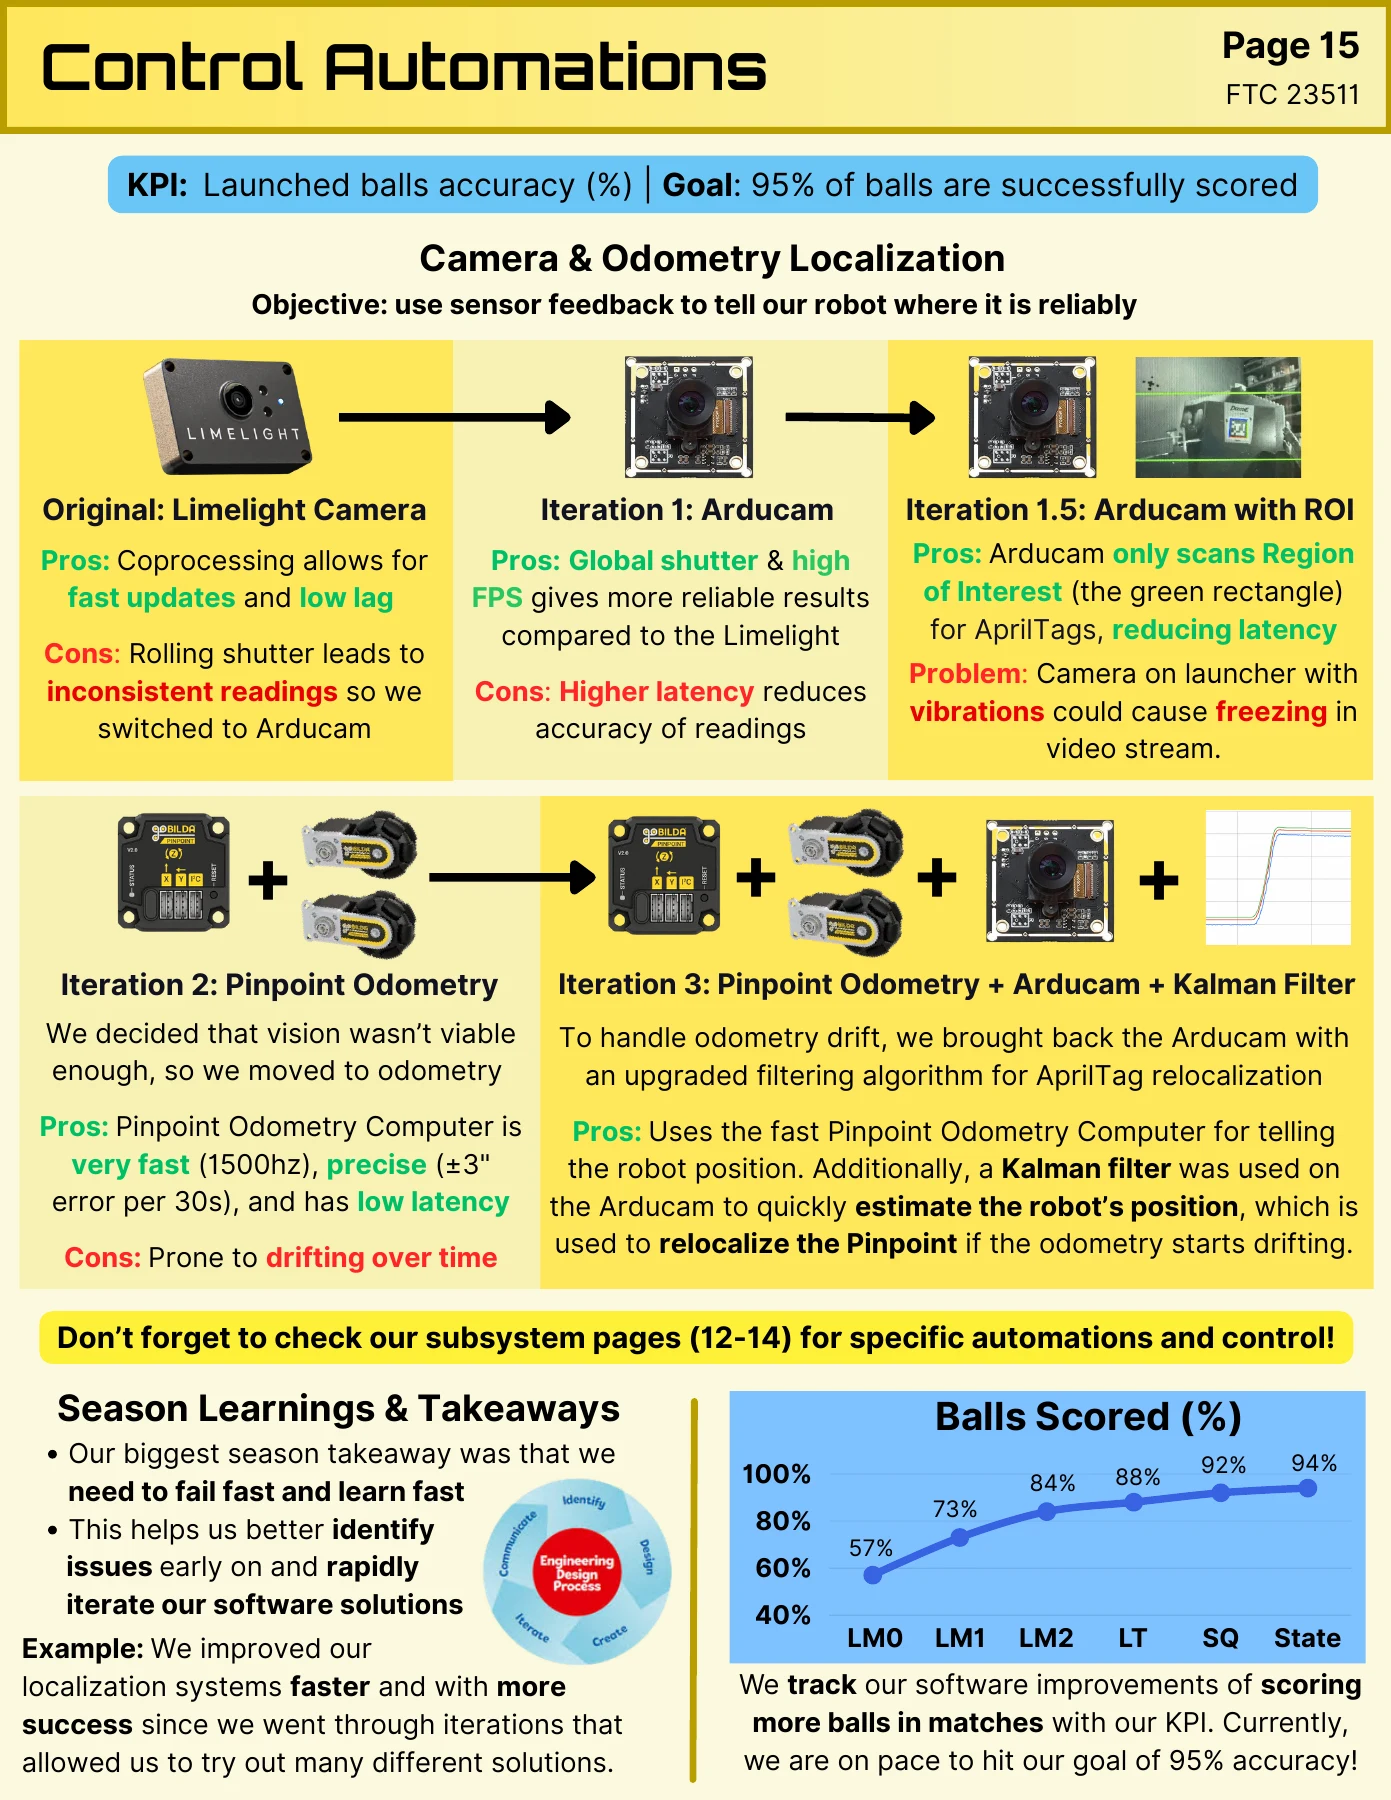
This is a useful structure when a list of libraries would hide your decisions. For each revision, explain what you measured, what limitation you encountered, and why you kept or replaced that approach. Keep a proposed next version separate from the system already tested.
The page's hardware and performance statements describe that team's historical setup. Use the current localization and vision guides when choosing or implementing your own system.
Software choices
Name the libraries you used and credit their authors. Then explain your team's work: setting up hardware, tuning controllers, combining sensor readings, writing recovery code, or comparing approaches.
A state diagram can show the order of actions. A feedback diagram can show how a measurement changes motor output. Explain unfamiliar terms where they appear, and spend most of the space on your robot.
Autonomous
Draw the route and label the actions along it. Include sensor checks, choices the code can make, and what happens if a move fails. If the routine changes to suit an partner, explain that too.
Count complete successful runs separately from successful individual actions. A robot that follows its route but misses the scoring action has not completed the whole routine. State what counted as a pass, how many attempts you ran, and which robot and version you tested.
Use the same starting setup when comparing routines. Label a best run as a best run rather than presenting it as typical performance.
Testing and graphs
Choose a graph that answers a question:
| Question | What to plot or count |
|---|---|
| Does the lift stop at the target? | Target and measured position over time, with units |
| How quickly does launcher speed recover? | Speed before and after each shot, with the recovery threshold marked |
| How much does position drift? | Position error along a route, compared with a known reference |
| Does the routine finish reliably? | Complete successful runs out of all attempts, with reasons for failures |
Explain what the result led you to change. Update rate, accuracy, and successful runs measure different things, so label each clearly.
Super 7's DECODE page 15 gives another useful example: flywheel recovery plots are placed beside the problem of later shots falling short. Its control-testing explanation connects the algorithm to a physical effect the reader can understand.
For your own recovery plot, identify when a ball enters, show target and measured speed on the same time axis, and explain what counts as recovered. State whether values come from one illustrative run or a repeated test set. The flywheel guide explains the measurements behind that plot.
A -progress chart and a controlled comparison have different uses. The first shows how the assembled robot developed. The second holds the task and conditions steady to investigate a particular change. Give each chart a caption that tells the reader which question it answers.
Failure and recovery
Show what happens when a sensor loses its target, a jams, or a driver presses the wrong button. Explain how the robot stops or returns to manual control, and how you tested that behavior.
Blu Cru uses a state diagram to explain its driver and manual overrides. Seattle Solvers shows how its approach to localization changed through the season.
Driver controls
Explain which actions a driver can start, what the robot checks before continuing, and how the driver cancels an action. If you claim it saves time, compare the same task before and after the change.
For the code itself, see nonblocking code, PID control, and sensor fusion.
Draft one software story
Choose a feature the team has implemented, then assemble:
- The task and failure: what the robot needed to do, and the observed problem.
- The control path: a diagram connecting measured input, decision, , and feedback.
- Your contribution: what students wrote or tuned, with outside libraries credited separately.
- The test: software version, conditions, pass definition, attempts, and measured result.
- The recovery: what happens on a missing measurement, , driver cancellation, or STOP, and which of those paths you tested.
Use one diagram and one well-explained result as the centre of the page. Put setup details beside the feature they explain. If a result is still being collected, describe the current behaviour and the next test instead of adding an accuracy claim.